{{How to cite NGSmethDB}}
Intra-individual variation in cytosine methylation levels
As an example, we will retrieve the methylation levels of single cytosines of the gene AMH in samples of adipose, bladder and gastric tissue of the individual STL001.
1. Go to NGSmethDB and then click on Data access -> Track hubs -> Single-cytosine methylation -> Human – hg38 -> Genome map at UCSC.
2. Once at UCSC, type AMH on the search text field, then select ‘AMH (Homo sapiens anti-Mullerian hormone (AMH), mRNA. (from RefSeq NM_000479))’ and finally click go.
3. The browser then will show the genome region of chromosome 19 where the AMH gene is located: chr19:2,249,311-2,252,073.
4. Click Tools -> Data integrator.
5. In Add data source -> track group select ‘NGSmethDB: Methylation levels’ and Add succesively the subtracks STL001_adipose, STL001_bladder and STL00_gastric.
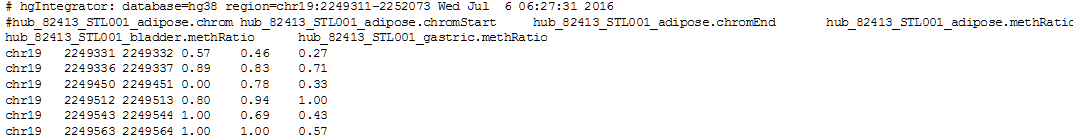
6. In Output options click on Choose fields… For STL001_adipose select the fields chrom, chromStart, chromEnd and methRatio. For STL001_bladder and STL001_gastric select only the field methRatio. Then click Done at the end of the page.
7. Click get output to obtain the result table in your browser (only a few rows and columns of the table are shown):
Inter-individual variation in cytosine methylation levels
As an example, we will retrieve the methylation levels of single cytosines of the gene AMH in the samples of adipose tissue in three individuals: STL001, STL002 and STL003.
1. Go to NGSmethDB and then click on Data access -> Track hubs -> Single-cytosine methylation -> Human – hg38 -> Genome map at UCSC.
2. Once at UCSC, type AMH on the search text field, then select ‘AMH (Homo sapiens anti-Mullerian hormone (AMH), mRNA. (from RefSeq NM_000479))’ and finally click go.
3. The browser then will show the genome region of chromosome 19 where the AMH gene is located: chr19:2,249,311-2,252,073.
4. Click Tools -> Data integrator.
5. In Add data source -> track group select ‘NGSmethDB: Methylation levels’ and Add succesively the subtracks STL001_adipose, STL002_adipose and STL003 adipose.
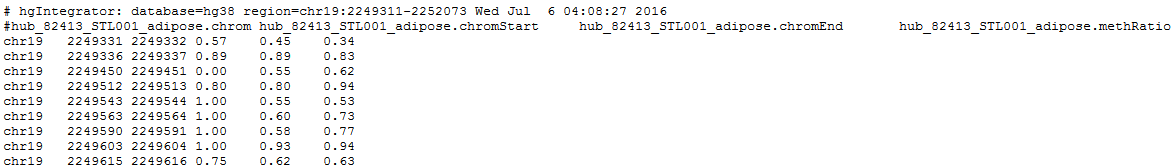
6. In Output options click on Choose fields… For STL001_adipose select the fields chrom, chromStart, chromEnd and methRatio. For STL002_adipose and STL003_adipose select only the field methRatio. Then click Done at the end of the page.
7. Click get output to obtain the result table in your browser (only a few rows and columns of the table are shown):
[[How to cite NGSmethDB]]
- Geisen et al. (2014) Nucleic Acids Res, 42, D53-9. Free Full Text
- Hackenberg et al. (2011) Nucleic Acids Res, 39, D75-9. Free Full Text
[[How to cite NGSmethDB]]